
I created a visualizer for the wind toolkit dataset at the National Renewable Energy Laboratory (NREL) using client side ES6 compiled through Babel and Webpack. NREL supports and maintains a dataset called Wind Toolkit. This is a large dataset which is hosted on NREL’s supercomputer, Peregrine. The public is entitled to free access of this dataset, but its large size presents a practical challenge to people who may want to use it. In order to provide easier access to this dataset, my colleagues at NREL implemented an API on Amazon AWS, developed with the HDF group, which provides fast access to rectangular slices of the data (this work was featured on the AWS Big Data Blog). The motivation behind WindViz was to create a visualizer to demonstrate this API.
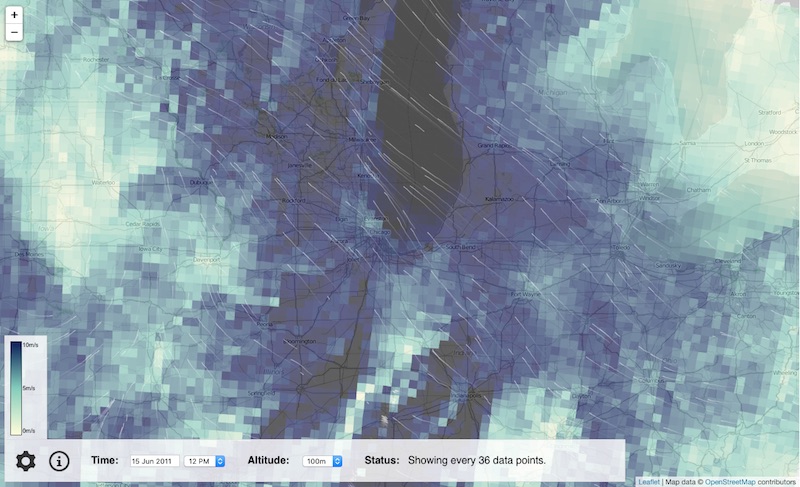
Rasterization of the windspeed data (to create the green and blue heat-map) presented a major challenge, since the coordinate system of the Wind Toolkit data is in Lambert Conic instead of Web Mercator. This meant that any rasterization algorithm would have to operate in the Lambert coordinate space before being projected into Web Mercator.
Part of the project specification stated that it must operate as client-side only Javascript. This was the first time I’d played around with “modern” Javascript. After experimenting with React.js and Aurelia, I decided to keep it simple and just a one-page HTML document animated by Javascrit. I design most of this code around the Leaflet.js library.
The code can be viewed through the Github repository. An interactive demo is hosted through Github pages.